
Estimated lives saved
≈ 2,410*
Projection based on the current test total.
Our impact
From a result captured in the laboratory to a programme’s view of its network. Explore the reach of DataToCare and the operational work that connectivity supports.
Explore featured programmes
Published reach
1,067
laboratories
20
countries
1,217,274
tests
1,198,878
patients
13 national rollouts reported in October 2026, a separate measure of national-scale deployment.
Last available figures · 28 October 2026 · DataToCare public counter
Published impact findings
DataToCare’s published impact assessment links diagnostic connectivity with more results transmitted and less time between diagnosis and treatment.
Estimated lives saved
Projection based on the current test total.
Reported financial savings
Cumulative savings reported by DataToCare since its first deployments in 2016.
* Estimated lives saved are extrapolated from the total test count using the September 2023 TB model at 0.00198 per test, rather than measured outcomes.
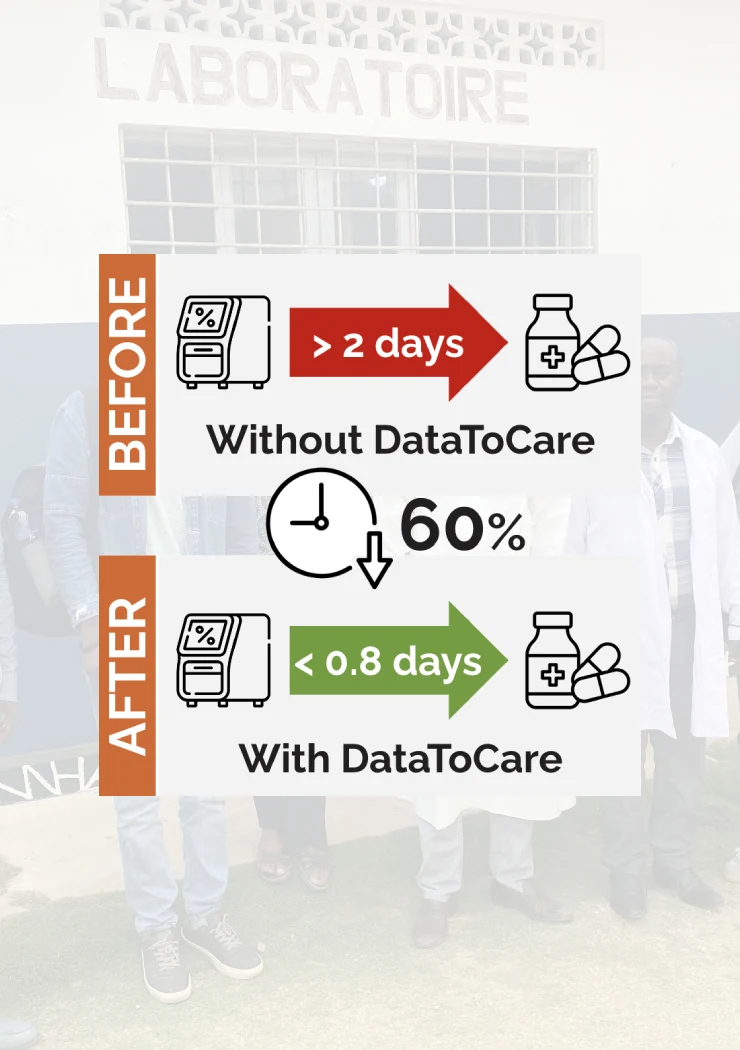
From diagnosis to treatment
The published before/after graphic compares diagnosis-to-treatment time. It does not measure only laboratory processing time.
60% reduction reported in the published comparison
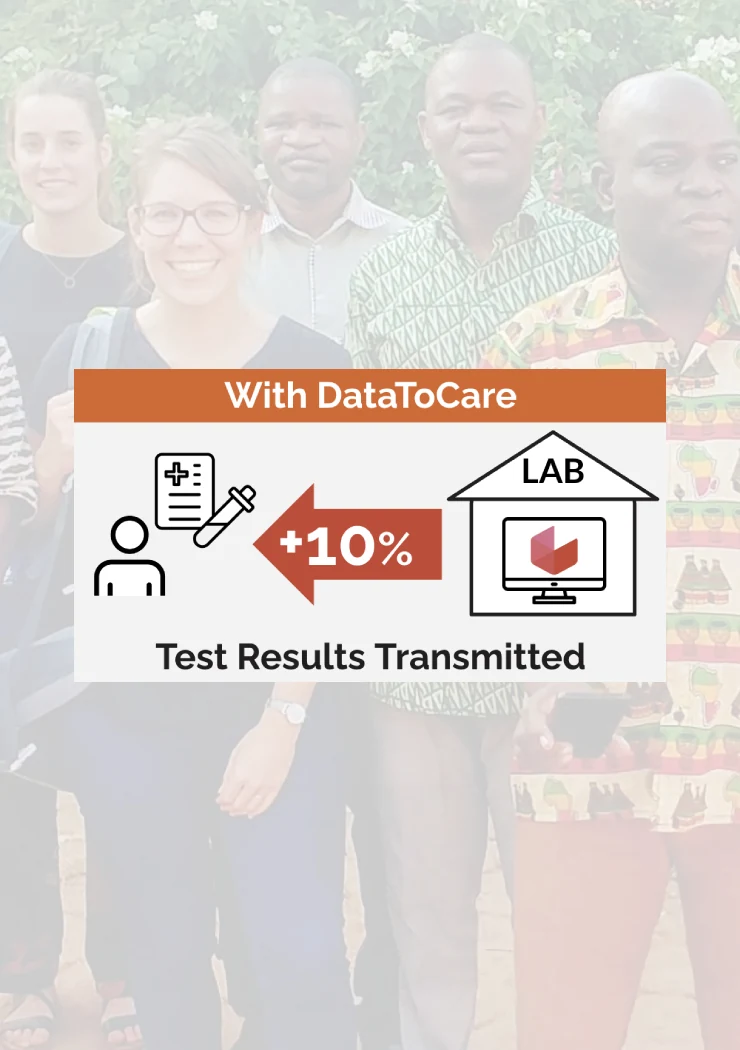
Results reaching the next step
+10%Increase shown in DataToCare’s published impact graphic.
Source: DataToCare’s published impact page (opens in a new tab) and the supplied comparison graphics. Financial savings and before/after comparisons remain historical findings. The original lives-saved estimate was 1,200+ in September 2023; the projection above is recalculated from the test total using that assessment’s model.
Reported programme result / Togo
Across facilities and devices in Togo since March 2026, as reported in October 2026.
Featured programmes
Deployed since 2016 with ministries of health and national programmes — primarily for tuberculosis, and also for HIV, malaria and hepatitis.
Burundi
56 laboratories
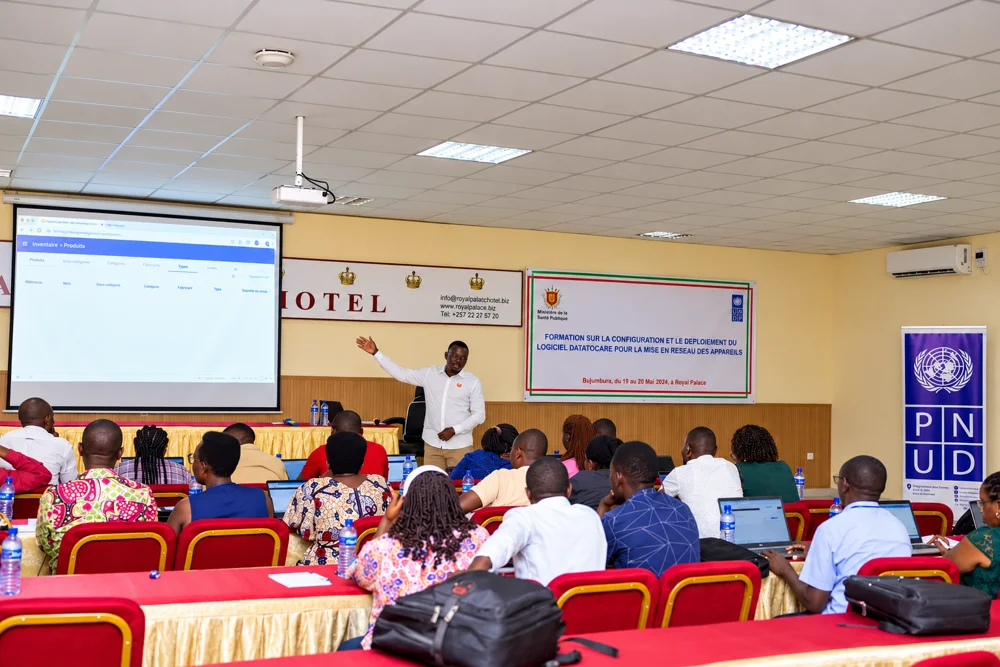
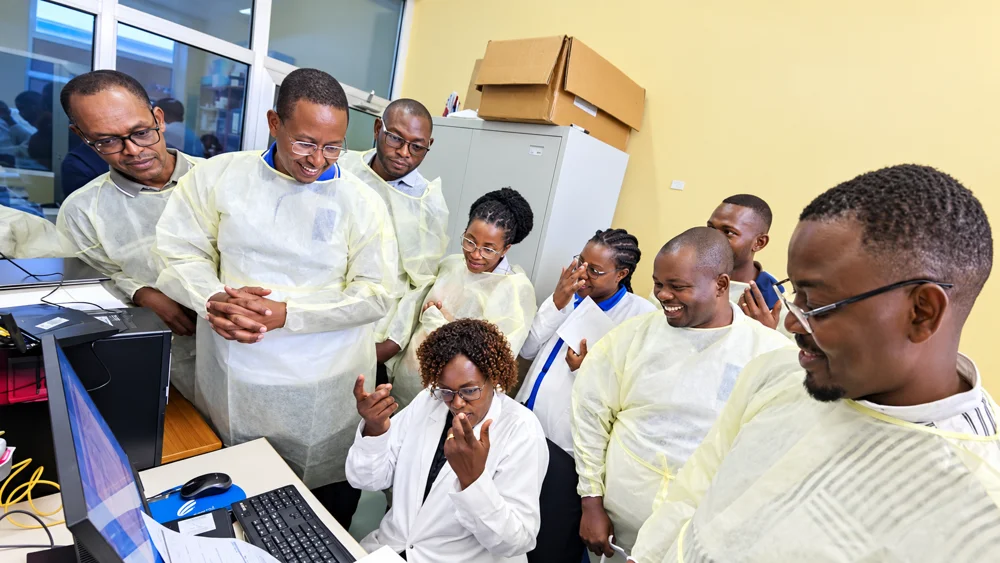
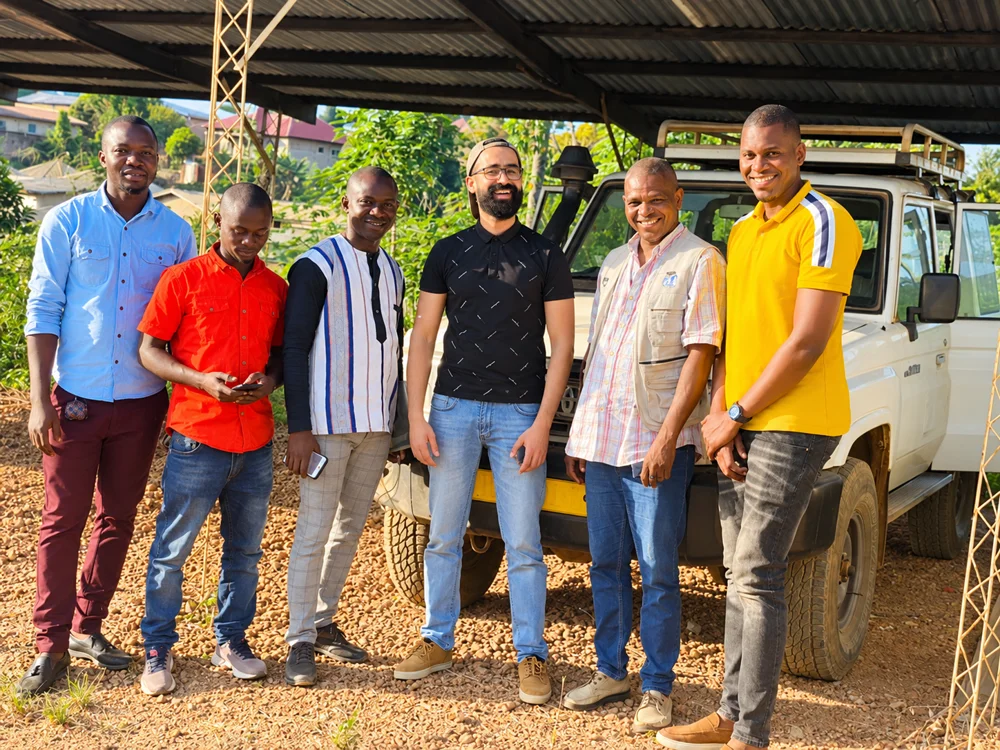
DataToCare connects Burundi’s laboratory teams to a shared view of diagnostic activity. GeneXpert connectivity, QuantStudio test-history recovery and central Web dashboards bring results together across the network. Delivered with UNDP and the Ministry of Health, the programme pairs instrument integration with practical Desktop and Web training, giving local teams the tools and skills to manage laboratory data and support continued deployment.
Guinea
21 laboratories
In Guinea, DataToCare combines laboratory connectivity with the skills to sustain it. Hands-on Desktop and Web training for laboratory teams and data managers is paired with on-site GeneXpert support. From Conakry to facilities beyond the capital, the focus is practical: helping teams use diagnostic data, manage synchronisation and build the local expertise needed to keep information moving.
Cambodia
56 laboratories
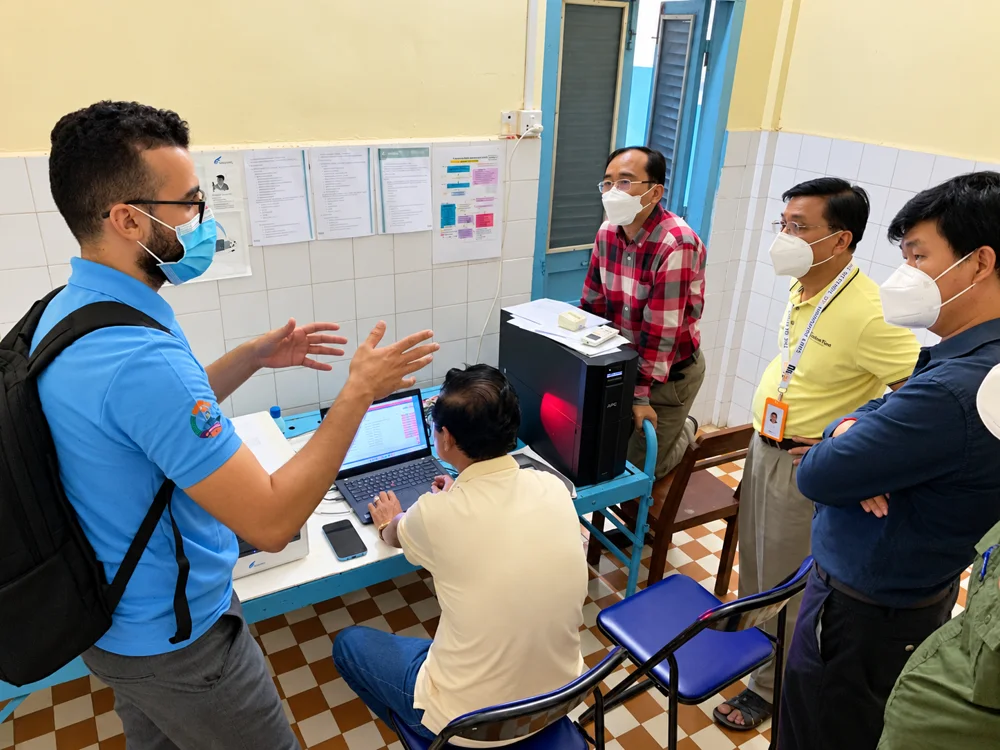
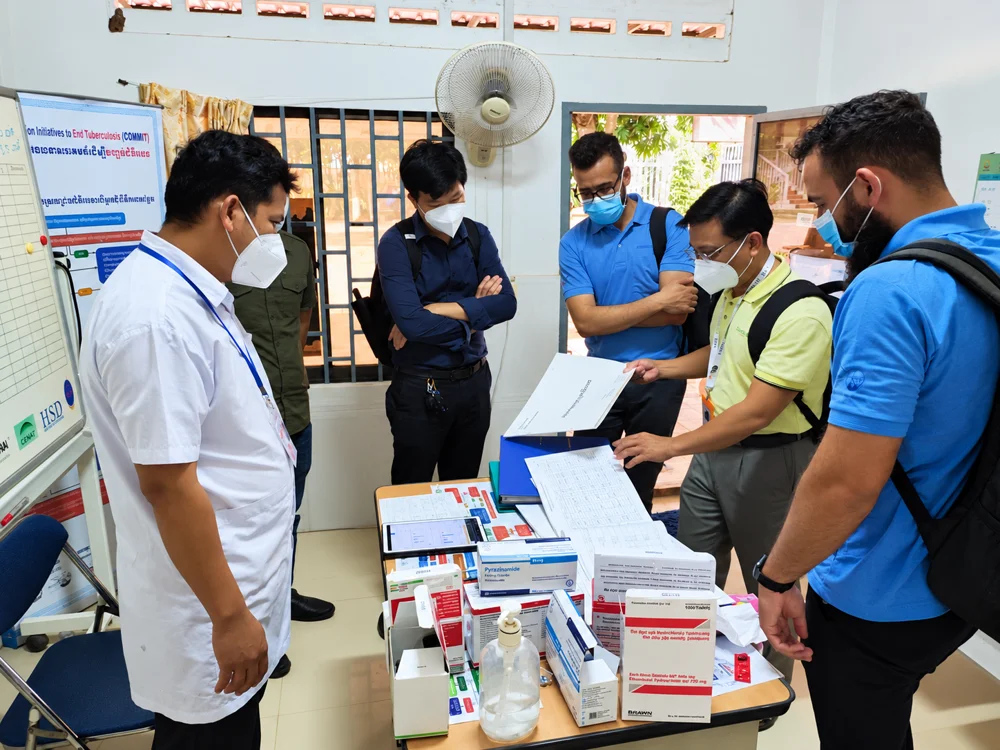
Cambodia’s DataToCare network brings automated TB result collection and laboratory activity into a shared view for the national TB programme. Building on an initial pilot supported entirely remotely by Savics, the programme combines diagnostic connectivity with close collaboration between local and technical teams. It gives programme teams visibility across a growing network, helping them follow laboratory activity and use diagnostic data for decision-making.
Togo
49 laboratories
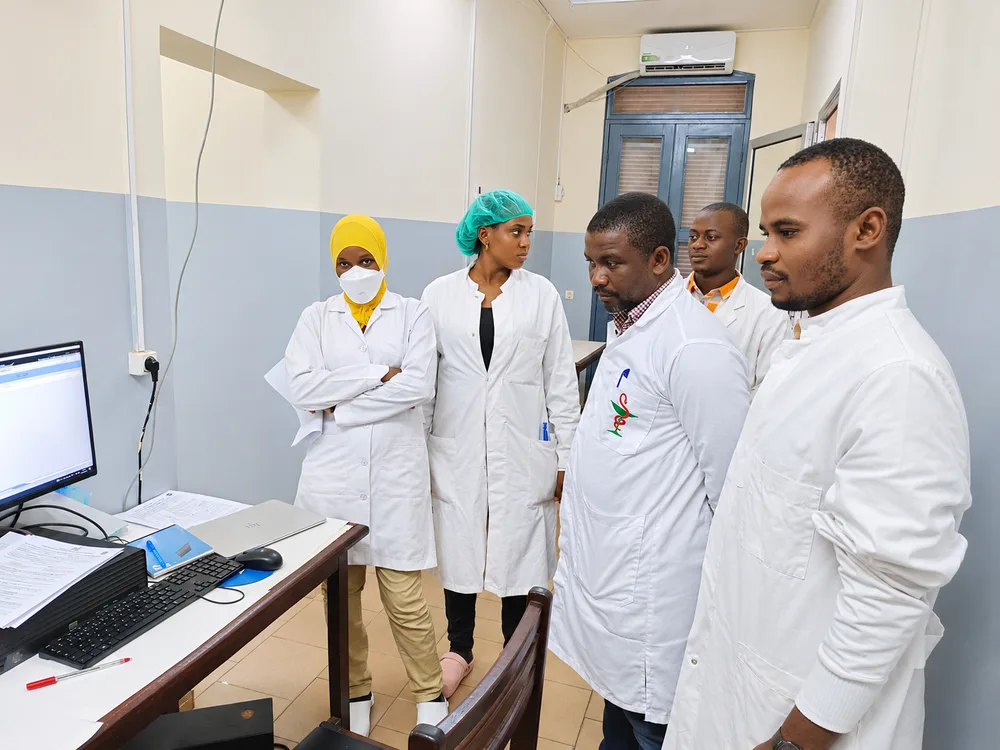
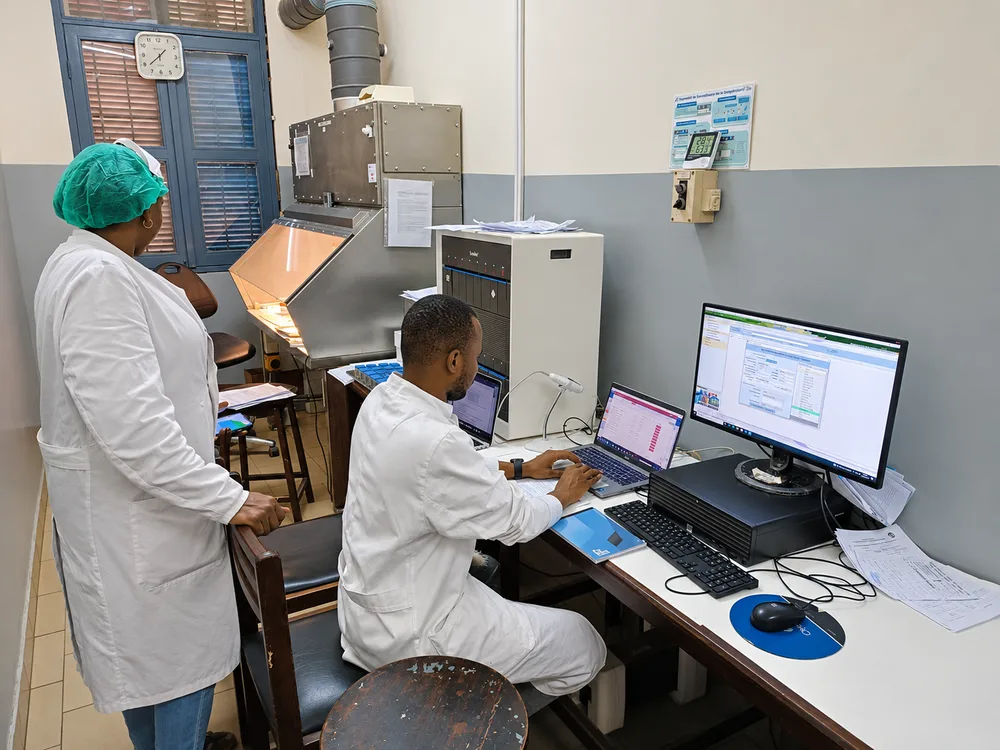
In Togo, DataToCare pairs laboratory connectivity with practical skills for the people who operate the network. GeneXpert order workflows, laboratory upgrades and super-user training help teams manage diagnostic activity and support their colleagues locally. By October 2026, reported connectivity across facilities and devices had remained at 94–100% since March 2026, showing the value of continued operational follow-up.
Explore the Togo finding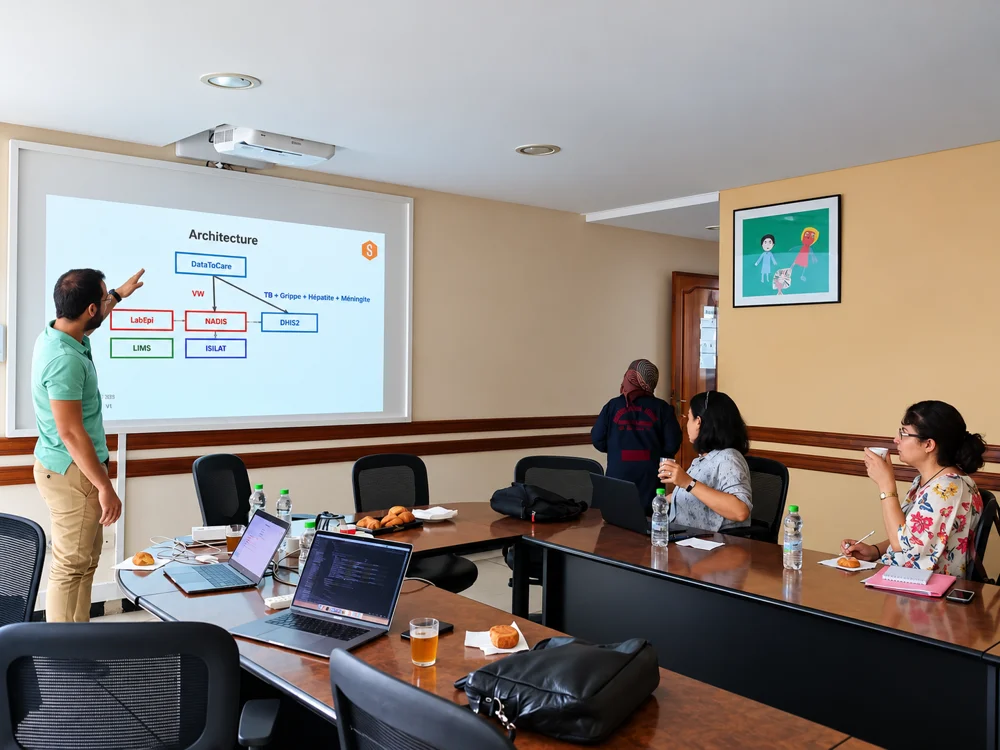
Kingdom of Morocco
75 laboratories
In Morocco, DataToCare brings GeneXpert diagnostic data from multiple disease programmes into a shared monitoring platform. TB, HIV and other diagnostic workflows sit alongside visibility into laboratory activity and instrument calibration history. This connected view supports disease surveillance and the day-to-day oversight of a diverse laboratory network, giving teams a common foundation for understanding activity across programmes and facilities.
DR Congo
DataToCare LIS installed in 249 laboratories · DataToCare LIMS installed in 13 laboratories
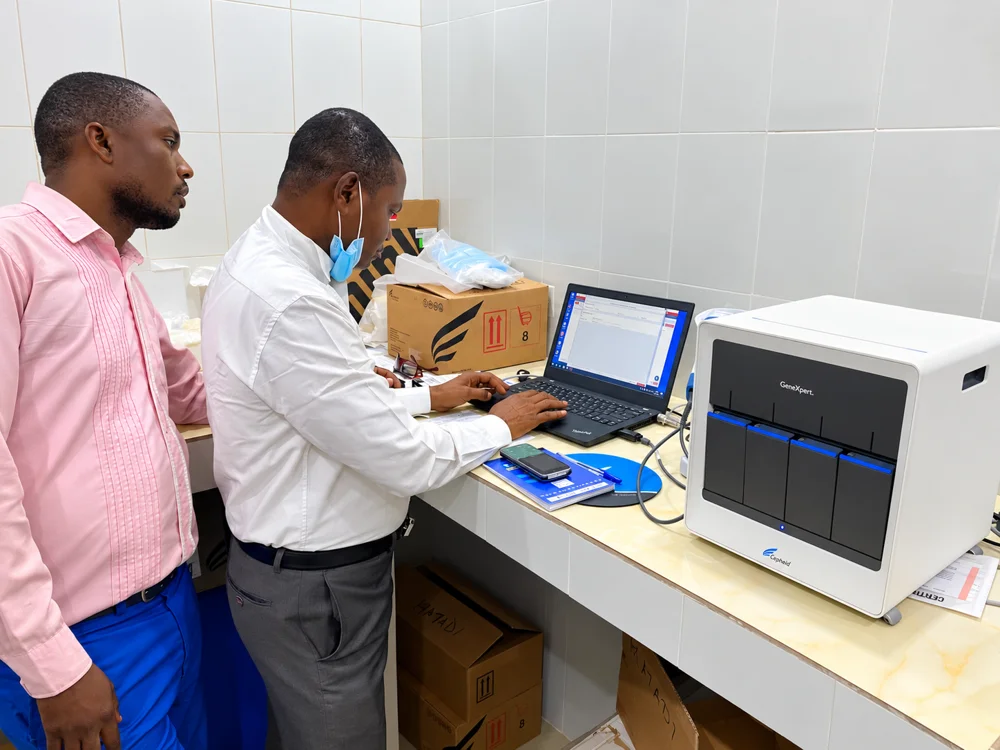
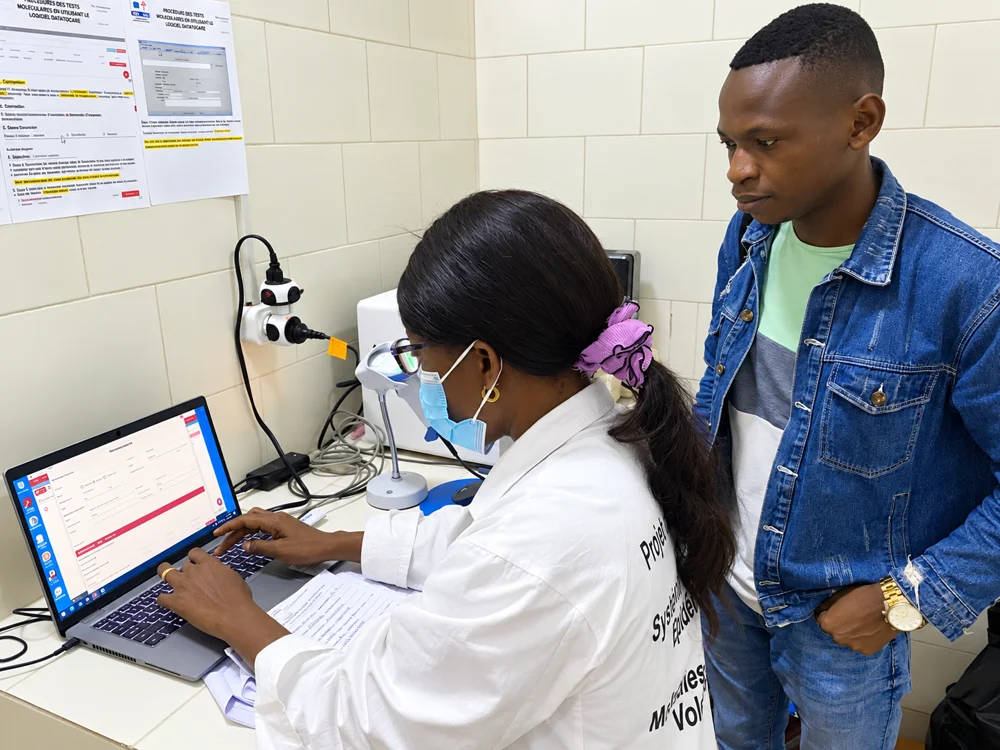
In the Democratic Republic of the Congo, DataToCare brings laboratory teams and national health programmes together across its diagnostic connectivity network and SIGIL, the country’s integrated laboratory information system. From TB and HIV to broader clinical testing, it connects diagnostic results, patient records and laboratory activity in one platform. Local and national dashboards give teams a clearer view of their network, while hands-on training builds the skills to manage and sustain the system locally.
Where DataToCare has been deployed
Africa · Benin · Burkina Faso · Burundi · Cameroon · Central African Republic · Côte d’Ivoire · Democratic Republic of the Congo (DRC) · Guinea (Conakry) · Liberia · Mali · Morocco · Niger · Rwanda · Togo · Zambia
Asia · Cambodia · Indonesia · Philippines · Thailand
Europe · Belgium
Explore the impact mapAround the world
Explore countries and laboratories using the interactive map. Select a country to see its laboratory network.
Open the map full size (opens in a new tab) ↗What connectivity supports
Instrument results join laboratory workflows, with local storage when the network is unavailable.
Configured result delivery connects the laboratory with the people waiting for information.
Dashboards and Intelligence help teams review activity, investigate unusual patterns and understand the supporting evidence.
Read the context
Explore the published background and connectivity literature. See the published impact findings and the wider connectivity literature.
Tell us about your laboratory network or national programme. We’ll show you DataToCare with your instruments, your reports and your connectivity constraints in mind.
Or write to support@savics.org